
Traditional ETL is Overrated. Here is What Actually Works
What No One Tells You About Query Folding and Data Model Optimization.


Power Query is the data transformation engine behind Power BI, Excel, and Microsoft Fabric.
It connects to hundreds of data sources, cleans, shapes data, and prepares it for analysis. Every transformation you perform in the Power Query Editor generates code in the M language.
Today I will explain how you can write better M code and build faster queries and data pipelines.
M language:
Power Query uses the M formula language to execute data transformations.
The engine operates on a lazy evaluation model where expressions compute only when a downstream step requires a result. Power Query organizes code with let and in blocks and references previous steps by name to create a transformation chain. The final value after the in keyword represents the query output.
M uses lists, records, and tables as core types. A table is a list of records, each record contains named fields.
The language supports iteration and recursive functions:
List.Generateworks as a while loop.List.Accumulate: Accumulates a summary value from the items in the specified listList.Transformapplies a function to every item in a list.Record.ToTableconverts records into tables for easier manipulation of field names and values.Recursive functions functions reference themselves by name.
Query Folding:
Power Query does not execute transformations in the order you write them but builds a query plan from your M code and figures out the optimal execution strategy.
The source native language translates transformation steps through query folding: SQL database, Active Directory, and SharePoint lists. Flat files: Excel and CSV files do not support query folding.
You should place filters and column selections at the start of your query.
Here are the functions that support performance through folding:
Table.Grouptranslates to GROUP BY instructions.Table.Sortcreates ORDER BY clauses in the native query.Table.Joinjoins table rows.Table.SelectRowsapplies conditional filters.Table.SelectColumns: same as SQL Select statement.
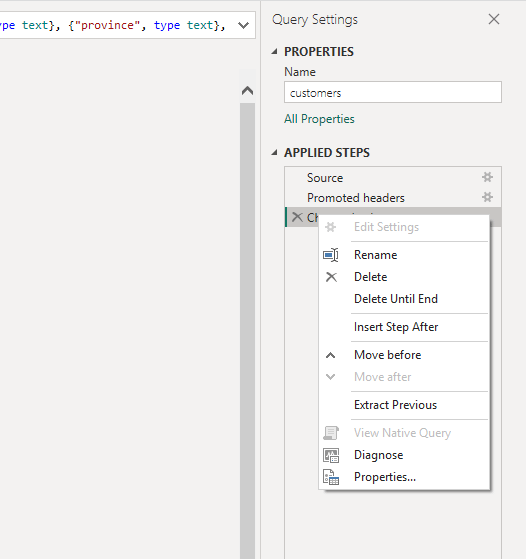
Go to Applied Steps pane, and right-click a step to select View Native Query. If you can select the option, it will push the execution to the source. A grayed-out option indicates the folding chain stopped.
There are 2 options: the data source does not support folding, or the applied operation does not have a folding translation.
Incremental refresh:
When you work with big data, you often do not need to update the whole data set. In this case, you should use the incremental refresh.
Incremental refresh in Power BI depends on query folding.
How to setup up the incremental refresh:
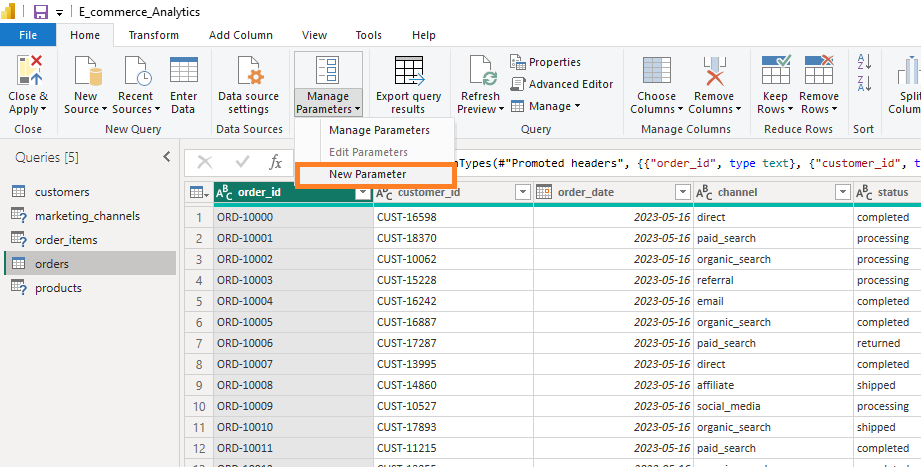
Go to the Home tab >> Manage Parameters, and select New Parameter.

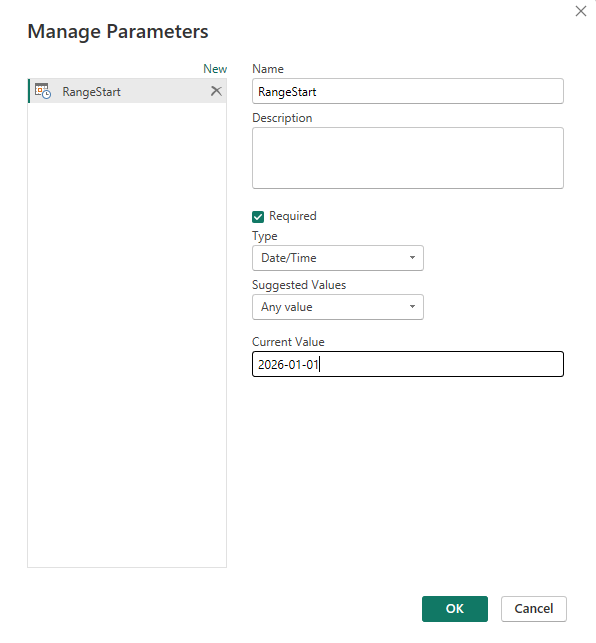
2. Create a parameter RangeStart with the DateTime data type.
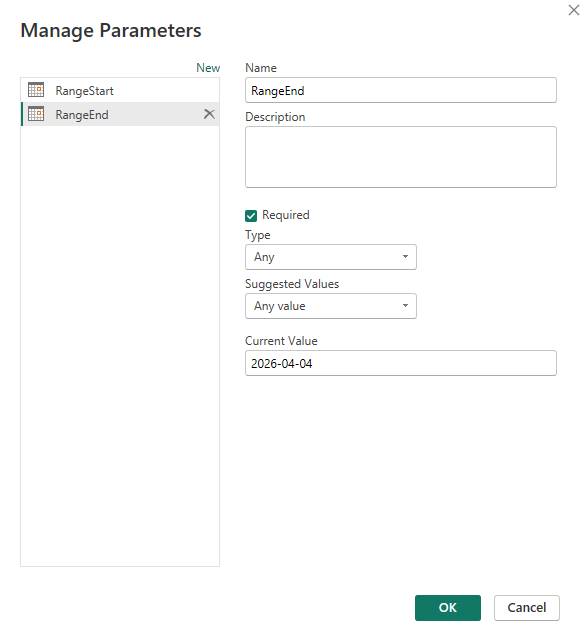
3. Create a second parameter RangeEnd with the exact same data type.
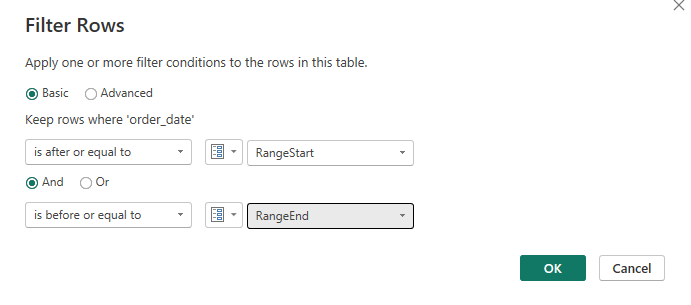
4. Go to your table that you want to refresh and find a date column. On a date column, click Date Filters >> Custom Filters…
5. Set the range start and range and parameters as boundaries for filtering.
6. Close and apply the changes to load the schema into the data model.
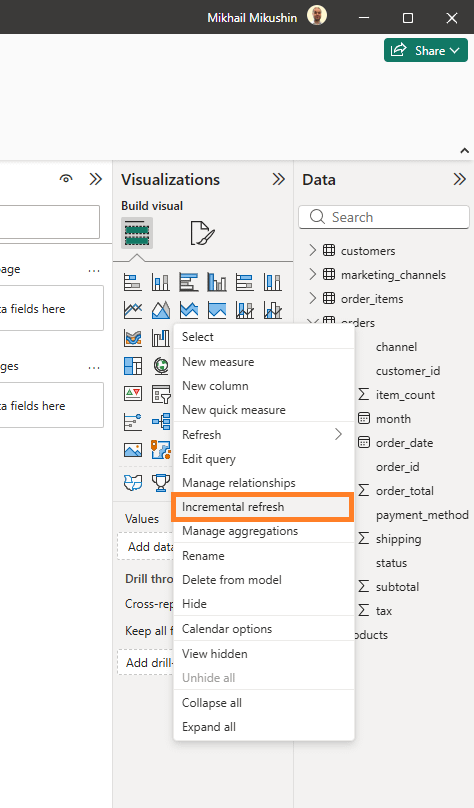
7. Right-click the table name in the model view to open the incremental refresh settings dialog.
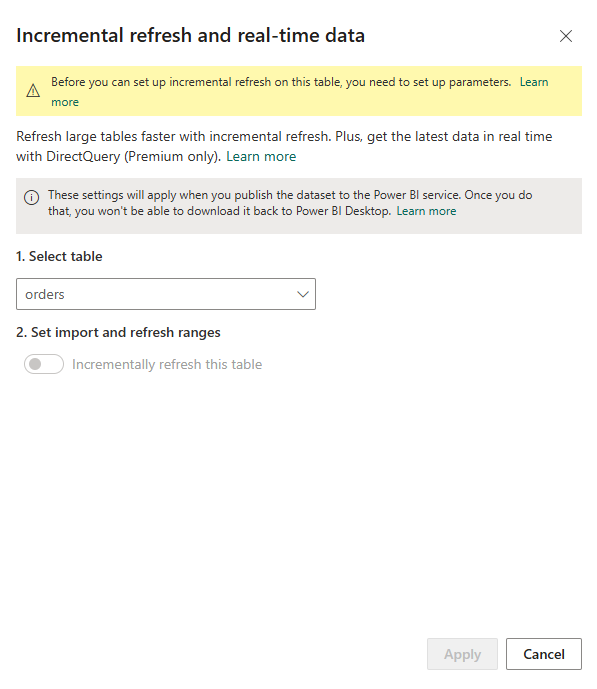
8. Define your historical retention period and your active refresh window before you publish your report to the cloud.
You should check if the step Power Query created for the filtering date is foldable. Otherwise, you will see this when you try to set up incremental refresh on your table.
Iteration and recursion:
List.Generate works like a WHILE loop.
It requires an initial starting position.
A second parameter evaluates if the loop continues.
A third step defines the next value.
= List.Generate(
    () => [X = 1],          // Start with a record where X is 1
    each [X] < 6,           // Continue while X is less than 6
    each [X = [X] + 1]      // Increment X by 1 each step
)
// Output: {[X = 1], [X = 2], [X = 3], [X = 4], [X = 5]}
You can use this function as a numeric counter or when you want to generate dates.
List.Accumulate is a reduction tool.
= List.Accumulate(
    {
        {”A”, “Alpha”},
        {”B”, “Beta”}
    },                          // Input list of replacement pairs
    “Target: A and B”,          // Seed text string
    (state, current) => Replacer.ReplaceText(state, current{0}, current{1})
)
// Iteration 1: Replaces “A” with “Alpha” in “Target: A and B” -> “Target: Alpha and B”
// Iteration 2: Replaces “B” with “Beta” in “Target: Alpha and B” -> “Target: Alpha and Beta”
// Output: “Target: Alpha and Beta”
You can use this function for bulk text cleaning, as a complex multicolumn filter, or when you want to build custom aggregations.
Recursive functions call themselves during evaluation.
Recursive functions call themselves by name within their own body, and they must include a termination condition to avoid infinite loops.
Recursion processes data slower than iterative methods like List.Generate.
Buffering:
Power Query uses memory buffers to prevent the engine from repeating expensive data fetches. You can use Table.Buffer and List.Buffer functions to force data buffering into RAM.
Buffering inside List.Generate:
List.Generate evaluates its loop condition against the source data on every single iteration. Without a buffer, the engine reruns the entire source query for every row it generates.
Example:
let
    Source = Sql.Database(”ProductionServer”, “SalesDB”),
    Data = Source{[Schema=”dbo”,Item=”DailyQuotes”]}[Content],
    SelectedColumns = Table.SelectColumns(Data, {”QuoteID”, “Price”}),

    // Memory buffering ensures List.Generate reads from RAM, not the SQL Server
    BufferedTable = Table.Buffer(SelectedColumns),
    TotalRows = Table.RowCount(BufferedTable),

    GenerateLoop = List.Generate(
        () => [Index = 0, AccumulatedPrice = BufferedTable{0}[Price]],
        each [Index] < TotalRows,
        each [Index = [Index] + 1, AccumulatedPrice = [AccumulatedPrice] + BufferedTable{[Index] + 1}[Price]],
        each [AccumulatedPrice]
    ),

    ConvertedTable = Table.FromList(GenerateLoop, Splitter.SplitByNothing(), {”RunningTotal”}, null, ExtraValues.Error)
in
    ConvertedTable
Performance tests show a buffer inside List.Generate can decrease query time by up to 60% in some cases.
Table.Buffer loads a table into memory, but nested tables or records inside rows may still be fetched from the source when accessed. The behavior depends on connector and the structure of the data.
You can choose between eager and delayed modes for loading.
Eager mode loads everything into memory immediately.
Delayed mode waits until a step requests a row.
Caching stops query folding. Once the engine stores a table in memory, it cannot send transformations to the database server. It also consumes significant amounts of RAM.
Here are the use cases for buffering:
Scenario 1: Prevent duplicate database requests during table merge:
When you buffer a table before a self-merge, it stops duplicate database queries and forces Power Query to read both sides from local RAM.
Scenario 2: Speed-up row-by-row lookups in custom columns:
Table.Buffer locks the lookup dataset into memory and converts thousands of slow database requests into fast local memory reads.
Scenario 3: Eliminate the source recomputation in the List.Generate loops:
If you apply a buffer before the start of the loop, it prevents the generator from requesting a fresh download of the source table during every iteration.
Fuzzy matching:
Fuzzy matching helps you merge tables when text entries contain minor differences like misspellings or extra spaces.
You can select the fuzzy matching option in the table merge dialog box.
The similarity threshold controls the sensitivity of the matching process from 0 to 1.
A threshold of 1 is a standard join.
0.8 will catch common typos.
0 will match all rows to each other regardless of their content.
You can also choose to ignore case differences during the comparison.
The engine can combine text parts to find matches, for example, to link Microsoft with Micro Soft.
Fuzzy grouping consolidates approximate matches in a single table. Define a similarity threshold to cluster variations of a category name into one group.
The native option works in Power Query Online, where you click on the column, select Group By, and pick the Fuzzy Grouping option.
If you use a desktop version, you must use Table.FuzzyGroup. If you do not want to write the code in the Advanced Editor, you can save your Power BI project as *.pbip and ask your favorite AI agent to do that for you.
Columns from Examples:
The Column from Examples functionality generates transformations with sample values.
Go to the Add Column tab, then choose Column from examples.
For example, you have several columns in your table, and the first is starting date and the last is end date. You want to see a difference in days.
You can type the difference in days into a new column in several cells, and the engine analyzes the inputs and proposes the M code to get the desired output.
Another use case for this is when you have a date column with different formats, so for each of the different formats, you can provide an example, and it automatically populates the rest.
Column profiling:
Power Query provides features to check data quality within the View tab: column quality and column distribution.
Evaluation defaults to the first 1 000 rows, but you can switch the analysis to the whole data set. It depends on the size, if it will not work, or how long it will take. Column quality shows the percentage of valid entries, errors, and empty cells.
When you select the column, you see the profile statistics: counts for empty strings and minimum / maximum values.
Query diagnostic tools:
The Query Diagnostics tool provides information about performance bottlenecks and logs evaluation events.
It records data source calls and transformation execution duration and captures buffer reads and type checks internal operations. You can find these features on the Tools ribbon.
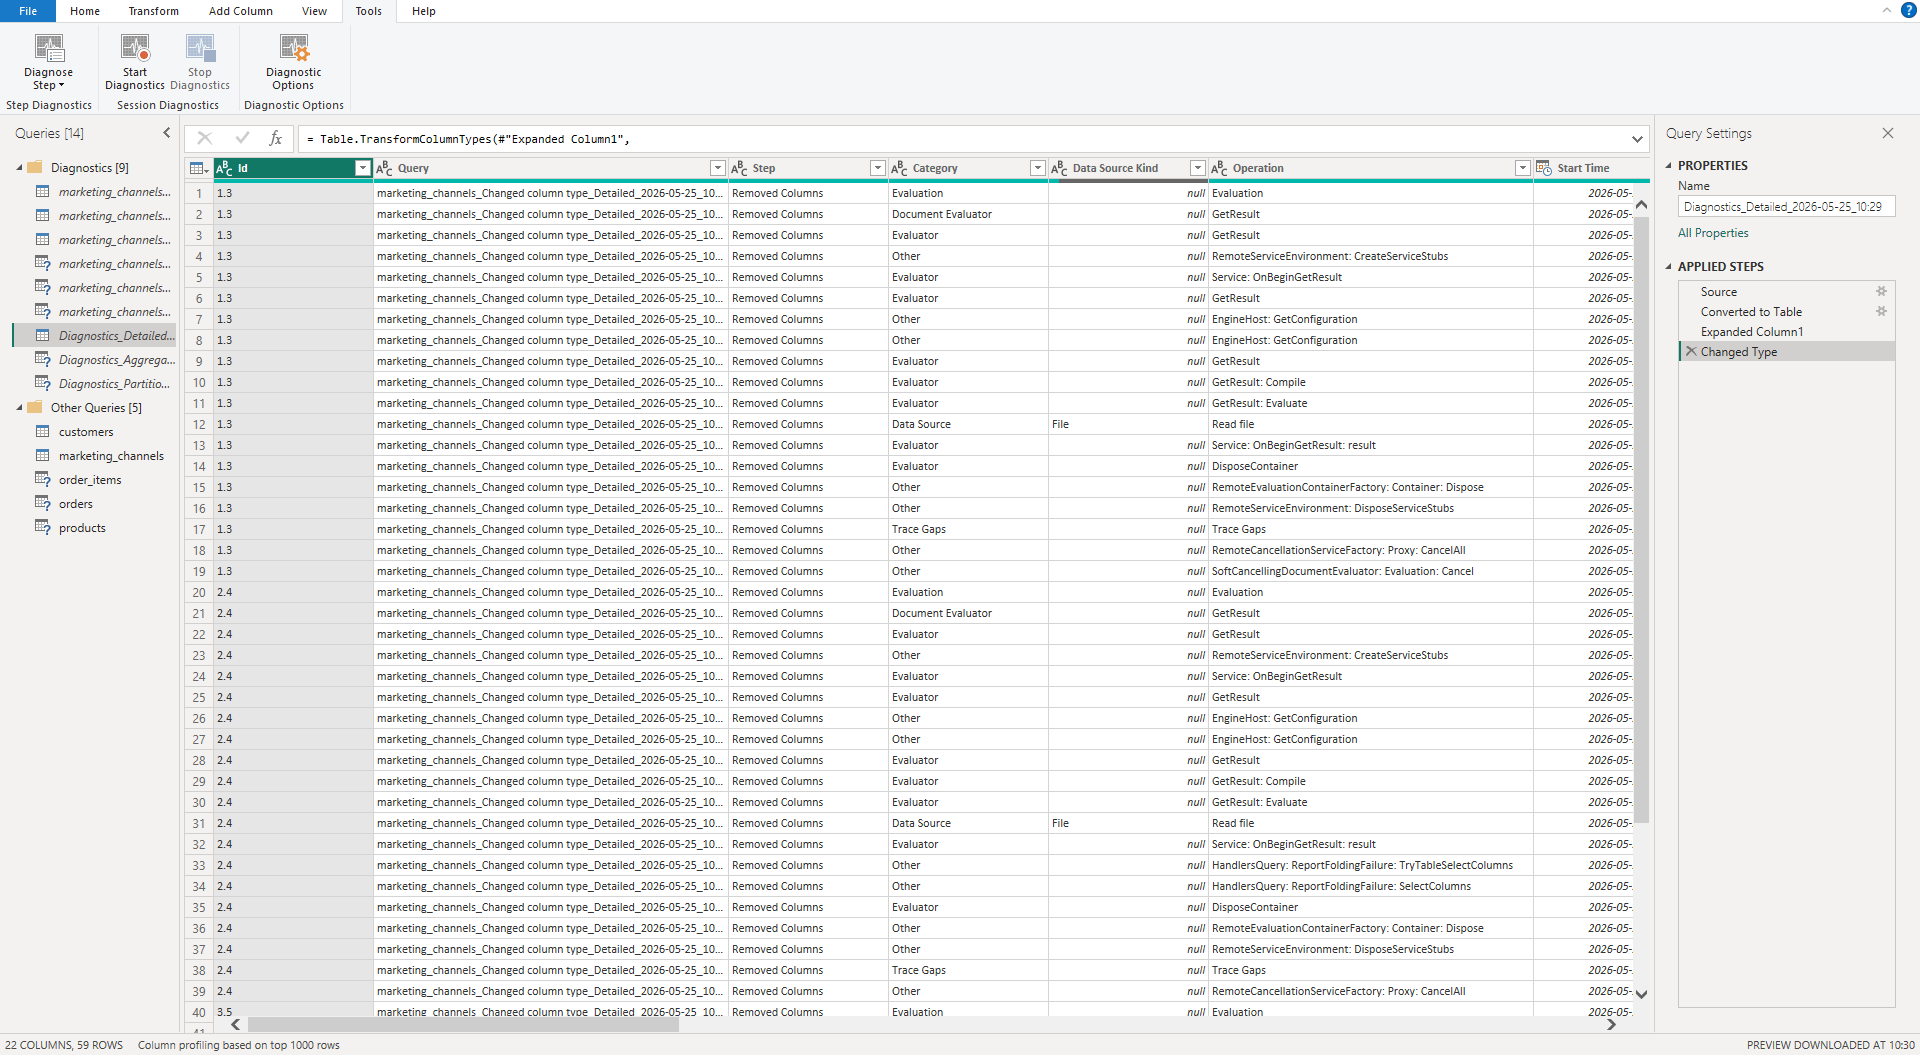
If you want to initiate a diagnostic session, you need to start the trace and then refresh your query.
Power Query creates tables with steps that consume the most time. These outputs separate data into two perspectives.
The summarized view groups related operations with total time spent on transformations.
The detailed view isolates individual operations for granular troubleshooting.
Error handling:
Try…Otherwise
Power Query isolates errors within cells.
Use the try...otherwise in the same way as IFERROR function in Excel. try Number.From("abc") otherwise 0 will return a zero for an error record.
If a row contains an invalid input for the division formula, the otherwise clause will provide a default number.
Table.ReplaceErrorValues will replace all errors in a specified column with a single default value.
Try…Catch
Power Query can isolate problems within variables or table cells.
The engine raises an issue when a step calls for the incorrect value. Use the try...catch to find these problems and inspect the cause.
While try...otherwise provides a fallback value, it does not have the diagnostic context with an explanation.
Best practices:
Place foldable operations: filters and column selections at the start of the query.
Apply sorting transformations or adding index columns at the end of the pipeline and keep the folding chain intact.
Use a
Table.Bufferwhen you reference the same dataset multiple times in lookups to avoid redundant source calls.Name applied steps with CamelCase with descriptive titles.
Organize queries into groups. For example, raw data or staging.
Explain the reasoning behind transformation in the step description.
Reference queries instead of duplicating them.
Trim and clean text keys before merging.
Generate records within a single step and keep the applied steps list short.
Enable column quality indicators in the view tab and monitor valid entries and anomalies.
Disable the load for intermediate queries.
Follow me for more Power BI and data guides!
What is your biggest Power Query performance challenge?
Let me know in the comments below👇