
Stop Answering the Same Questions Twice: Build a Data Dictionary
The Lazy Analyst’s Guide to Power BI Documentation.


To create a professional and useful Power BI report, you must understand how to run your data model efficiently.
Many data analysts build reports that look good but perform poor because the underlying structure lacks organization.
This article explains how to build a data dictionary and use advanced Power BI features to improve your reporting workflow.
What is it?
A data dictionary describes the contents, format, and structure of a database.
In Power BI, it means documenting your tables, columns, and measures. You need a data dictionary to maintain consistency across your team.
Without it, different people will interpret the same field in different ways.
Why Do You Need a Data Dictionary?
Users often ask what a specific metric means.
If you do not have a documented definition, you waste your time answering the same questions over and over again. Anyone who opens your report can understand the logic behind your calculations, and it helps you hand over a project to another person.
They will see how you built each measure and where the data comes from.
What to Include in Your Dictionary?
Your data dictionary must cover several key elements for every object in your model.
For tables, list the table name and the source system. Specify if the data comes from SQL Database, Excel, or a cloud API. Include the refresh frequency so users know how current the data is.
For columns, document the column name and the data type. Data types include text, integer, date, or decimal. Write a description of what the column represents. If you renamed the field from the source, include the original source column name. List any business rules you applied during the data transformation process.
For measures, document the measure name and the DAX expression. Provide a clear description of the calculation logic. This is where you explain the business meaning of the metric.
Keep Your Model Clean:
A clean model is easier to document. Delete any measures or columns that you do not use in your report.
Every unused object adds unnecessary weight to your model and your documentation. Use display folders to group related measures.
For example, put all your Sales measures in one folder and KPIs in another.
Descriptions:
When you add a description to a measure or column in the Model View, Power BI displays that text as a tooltip.
When a user hovers over a field in the Data pane, they see the description you wrote. It reduces the number of support requests you receive because the report explains itself. To add descriptions, navigate to the Model View. Select a field or measure. In the Properties pane, find the Description box. Type a clear, concise sentence explaining the field.
Do not use technical jargon. Use language that your business users understand.
Relationships and Metadata:
Understanding how tables relate to each other is vital for troubleshooting.
You can document your model relationships with INFO.VIEW.RELATIONSHIPS(). This function provides details on the tables and columns, and it also shows the cardinality of the relationship, such as one-to-many.
It makes it easier to spot potential issues like circular dependencies or inactive relationships.
Automatic Documentation Methods:
Manual writing of documentation is a slow process. Use automated tools to extract metadata from your Power BI model.
You can achieve automation by retrieving the structure of a semantic model:
INFO.VIEW DAX Functions: functions
f,.COLUMNS,.MEASURES, and.RELATIONSHIPSwill help you create of dynamic, self-updating tables within Power BI.You can create a new table and paste a code likeInfo Measures = INFO.VIEW.MEASURESto get this table.Dynamic Management Views (DMVs): Tools like DAX Studio use DMV queries (like
SELECT * FROM $SYSTEM.TMSCHEMA_MEASURES) to extract technical metadata into CSV or Excel formats.Scanner API: For enterprise-scale automation, the Power BI Scanner API can scan entire tenants to collect metadata, including DAX expressions and Power Query M-code, for thousands of assets.
2. AI-Driven Description Generation:
Translate DAX to Plain English: LLMs like ChatGPT, Claude, and Gemini can analyze complex DAX formulas and generate concise, human-readable definitions.
For example, AI can take a formula and draft a description: “Calculates the percentage of profit relative to total sales”.
Microsoft Copilot: Integrated into the Power BI Model view, Copilot can generate descriptions for measures with a single click by analyzing the underlying code. However, it is limited to measures, and you need specific Fabric or Premium capacities.
Fabric Data Agents: Advanced workflows use Fabric data agents to interpret the results of functions like
INFO.CALCDEPENDENCY, creating Markdown-format documentation that describes how calculations work and how they relate to other tables.
3. TMDL and LLMs:
Bulk Editing: You can drag TMDL code into an AI prompt, ask the AI to populate all blank
descriptionfields, and then paste the updated code back into the model to update metadata in seconds.Human Review is Mandatory: AI can hallucinate or misinterpret a business idea behind that. A domain expert should validate that descriptions match the specific organizational context.
Focus on Business Context: Automation can duplicate a formula, but humans must explain why a measure matters and when to use it.
You can Export TMDL model and ask LLM to provide you a documentation.
Here is how to do it:
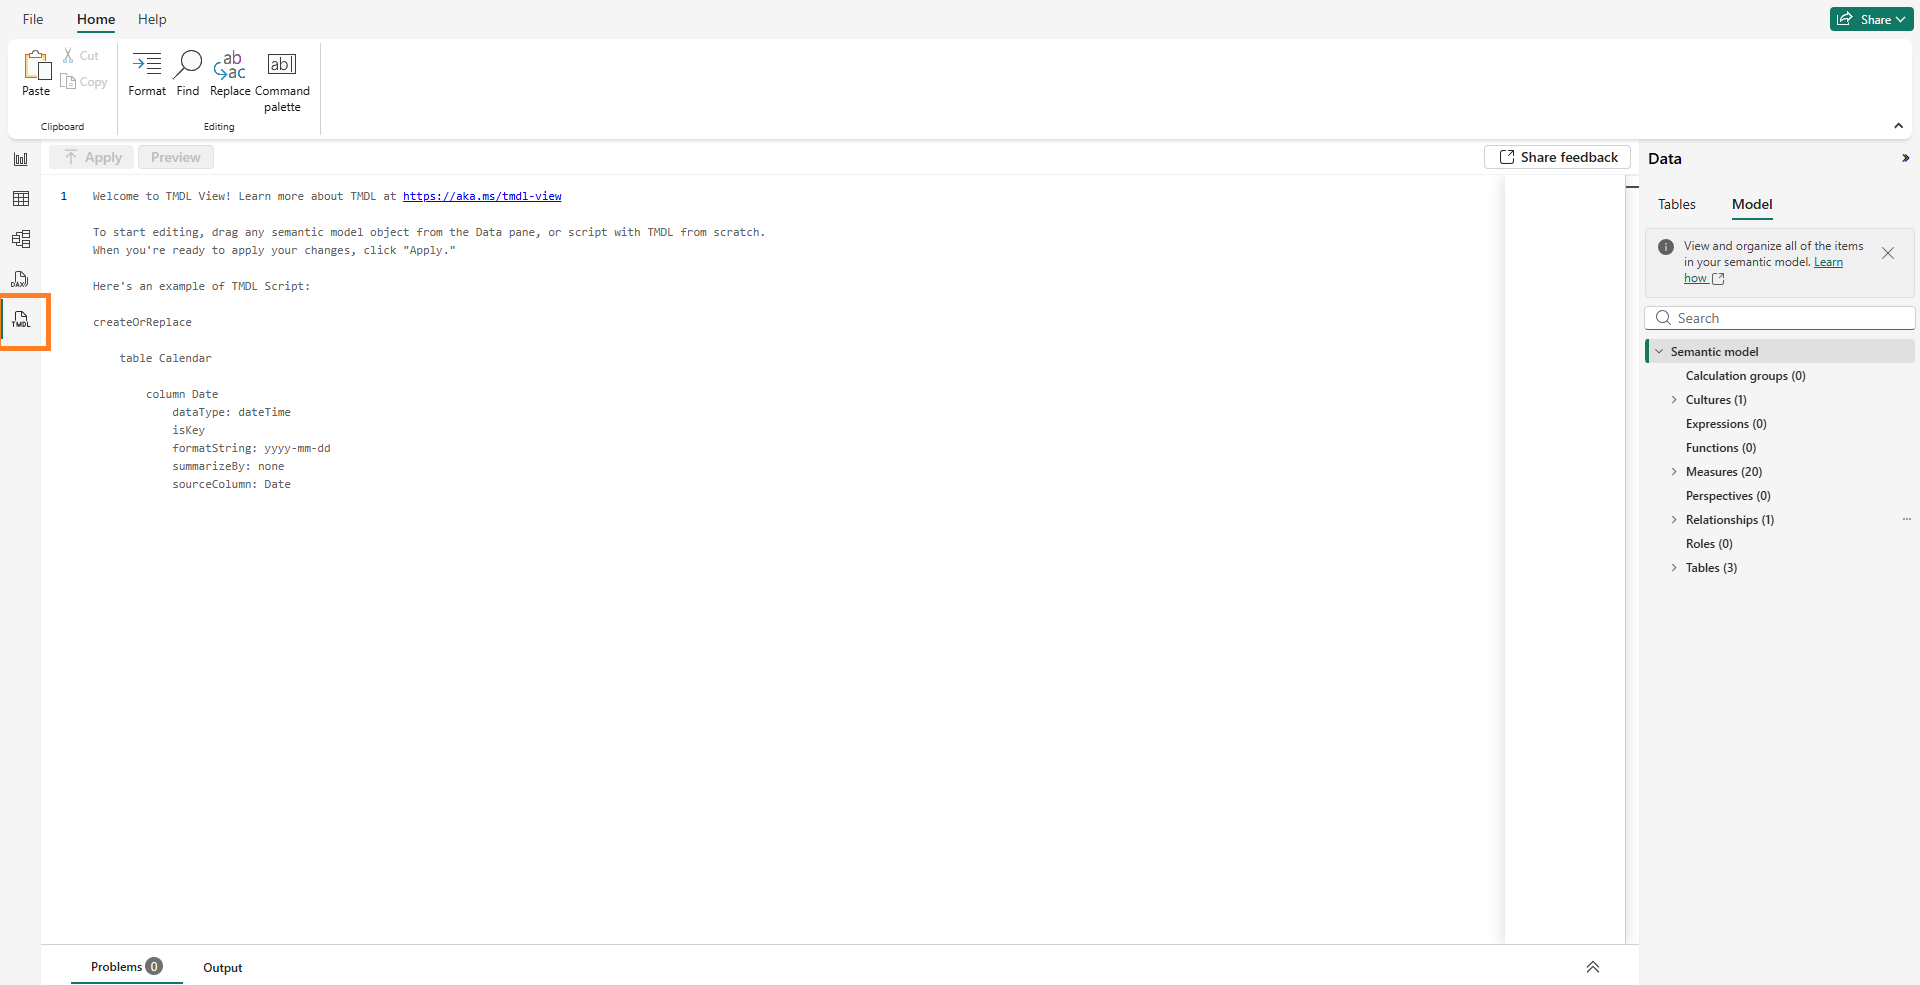
First, look at left navigation bar, find the TMDL view and select it.
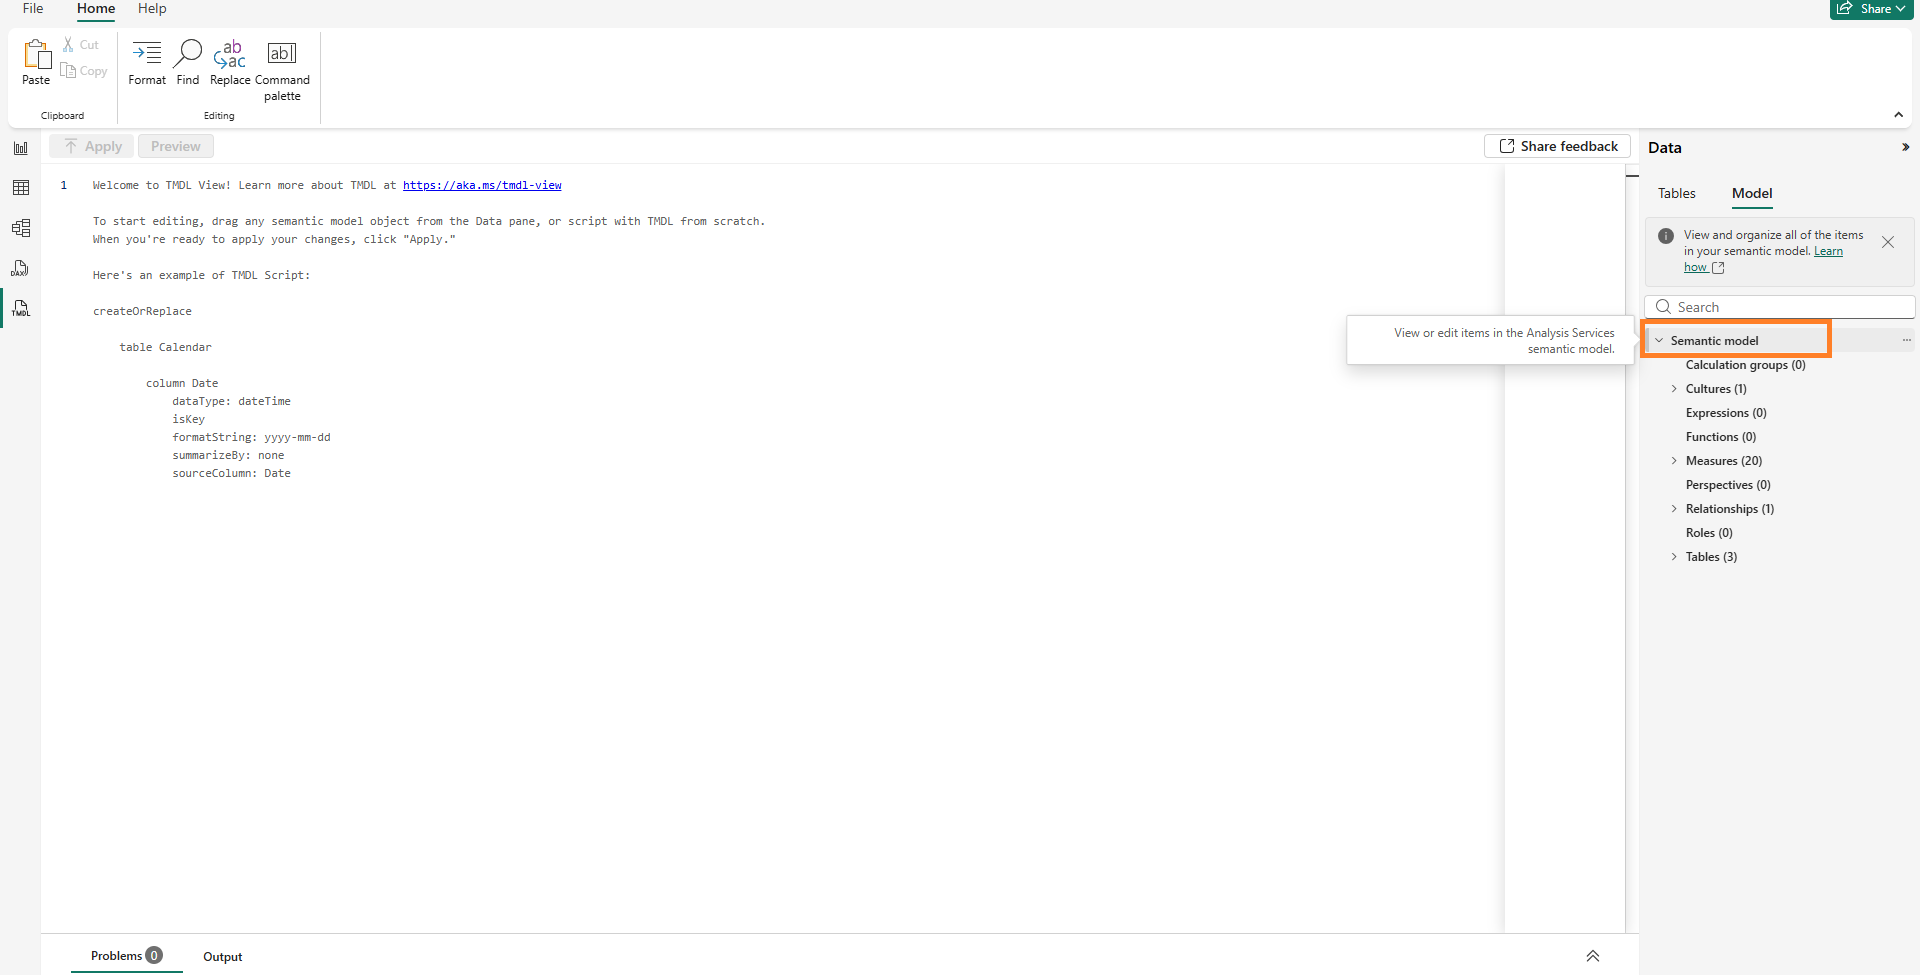
2. One the right select the model tab and find a semantic model.
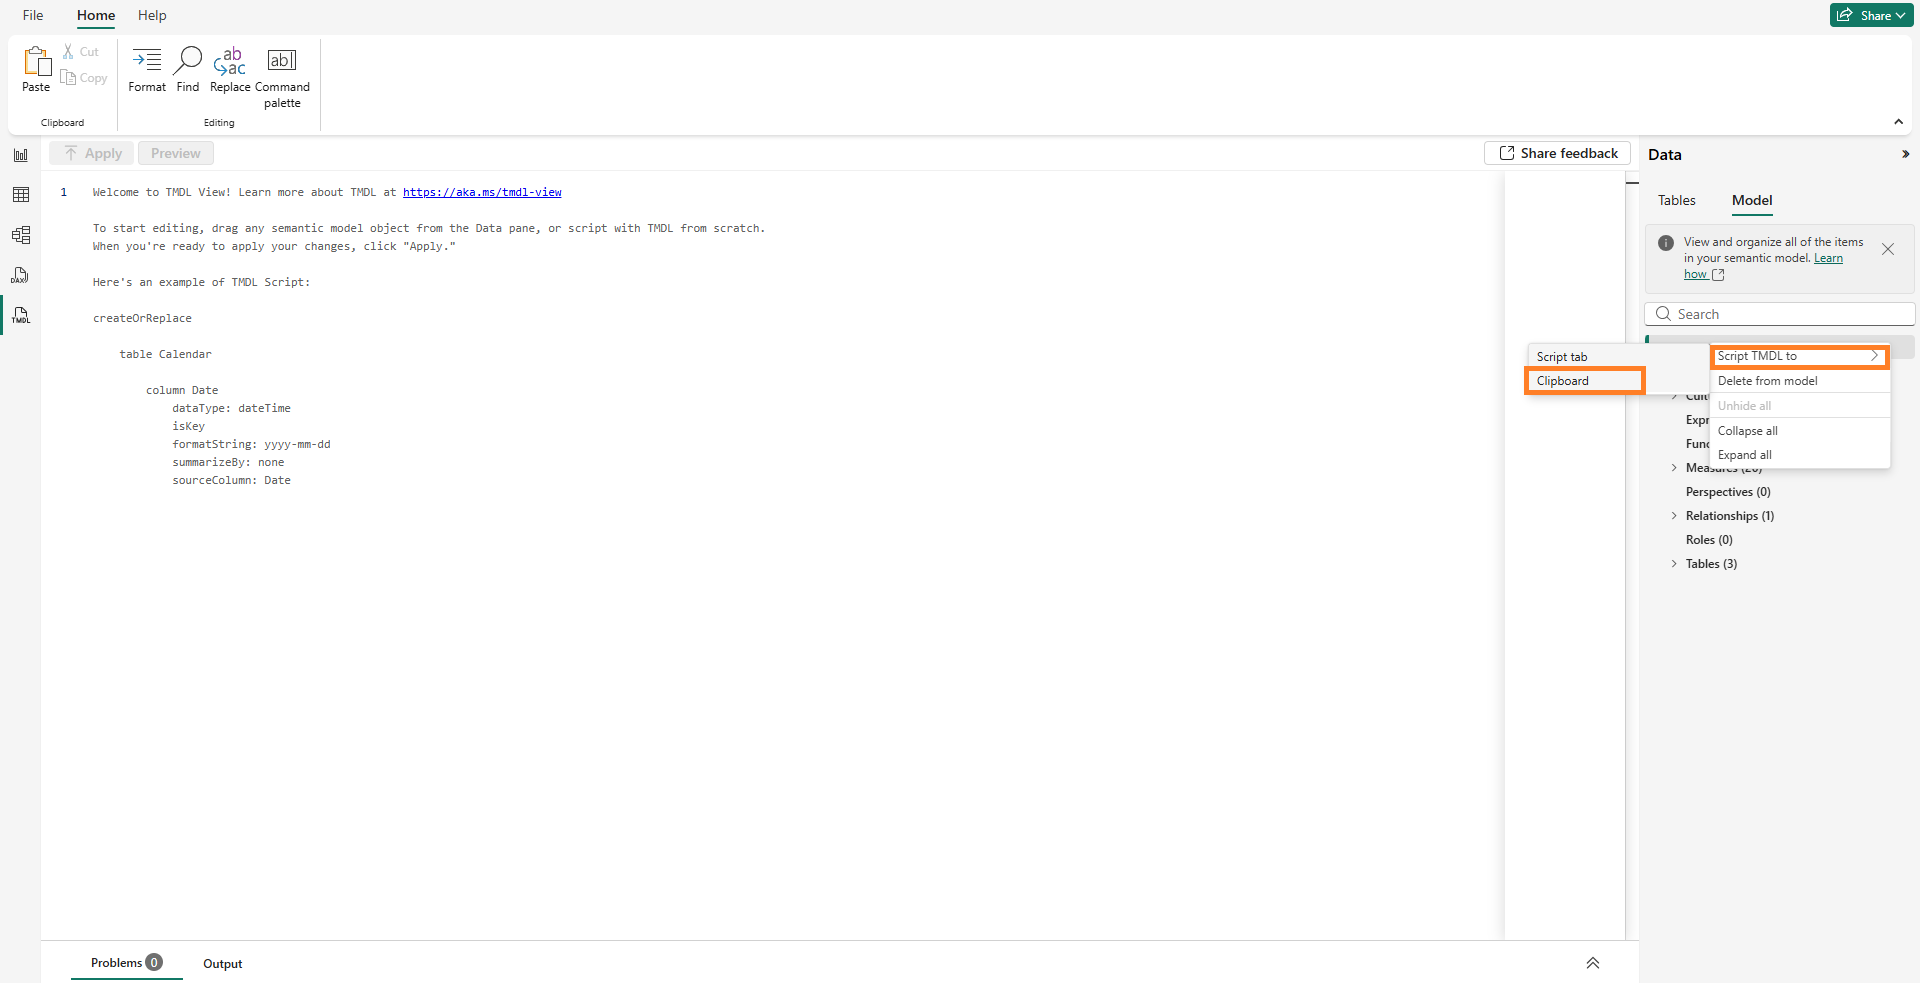
3. Right click on it and script TMDL to Clipboard.
4. Now open your LLM chatbot and paste copied text, followed by this prompt:
# ROLE:
- You are a professional documentation creator.

# OBJECTIVE (What must be produced):
- I want you to create a documentation for my Power BI Dashboard.
- I will provide you with my TMDL semantic model.

# STYLE RULES (Tone, structure, formatting):
- Tone: Strict, clear, professional.

# OUTPUT FORMAT (Exact structure required):
- PDF file.

# INPUT (The attachments / materials to process):
- My TMDL semantic model.
5. As a result, you will get a PDF file with documentation.
Feel free to modify the prompt, customizing the format or providing an example style.
Another good option is to connect LLMs to your report using Model Context Protocol (MCP).
Data Agents:
If you use Microsoft Fabric, you can use data agents to help document your models (currently in preview).
These agents can analyze your DAX code and suggest descriptions. While you should review the output accuracy, this can speed up the process of writing hundreds of descriptions.
Data agents can also help users by answering questions about the model in a chat interface.
Calculation Groups:
As your report grows, you might end up with hundreds of measures and create a navigation problem. Calculation groups can help you solve this problem with the same DAX principle across multiple measures.
How Calculation Groups Help?
You can define time intelligence rules once with a calculation group. You can create a calculation item for Year-to-Date with the SELECTEDMEASURE() DAX function and use it as a placeholder for whatever measure you put in a visual.
You can then apply Year-to-Date principle to any of your base measures. Instead of forty measures, you have ten base measures and one calculation group with four items.
Field Parameters:
Field parameters help to change the measures or dimensions displayed in a visual. You can build compact reports that provide a lot of information in a small space.
To create a field parameter, go to the Modeling tab, select New Parameter, and then Fields. Choose the measures you want to include. Power BI creates a table and a slicer for you.
When the user selects a measure from the slicer, the visual updates to show that specific data. You can use this to let users switch between Sales, Profit, and Cost within a single bar chart.
You should use dynamic titles with your field parameters. Create a measure that captures the selected value from the parameter table. Assign this measure to the conditional formatting option of the visual title.
Documentation Formatting:
Your documentation page should be as easy to read as your data visuals.
Use a simple table visual. Avoid excessive colors or complex formatting. Make sure the text in your description column does not get cut off. You might need to adjust the column width or enable word wrap.
If a measure has a very long DAX expression, think about the need to show the whole formula or just a summary.
Documentation Maintenance:
You must update your documentation every time you change your model.
If you use the automated DAX method, every data refresh updates it automatically. If you use external files, you must build the update into your development workflow. Do not leave your documentation for the end of the project.
Write your descriptions as you create your measures.
Share Your Dictionary:
You can publish your data dictionary as a separate Power BI report if multiple reports use the same semantic model.
Users can browse the dictionary to see what data is available before they start building their own reports. Before you publish your report, review your data dictionary page. Make sure that all measures have a description.
Check that the names are clear and the logic is easy to follow.
Expand Your Dictionary:
As you become more comfortable with metadata functions, you can add more detail to your dictionary.
Include information about data categories, such as whether a column is a city or a country. Document if a field is hidden from the report view. You can also document the DAX formatting strings.
Every piece of metadata you include adds another layer of understanding for your audience.
Best practices:
Educate Your Users. Include a “Help” or “Documentation” page in your Power BI report. Add a table to this page that displays the metadata you extracted with the INFO functions. Encourage them to check this page before asking questions about data definitions.
Fill Descriptions Early: Make it a standard habit to populate the Description field in the Properties pane for every object: measures, columns, and tables.
Use Business-Friendly Language: Avoid technical jargon, DAX terminology (
SUMX,Filter Context), or technical database IDs (”FK to DimDate”) when writing for report consumers.Consistency in Naming: Use standard, intuitive naming conventions for all fields. Avoid acronyms and abbreviations unless they are universally understood across the organization.
Detailed Attribute Inclusion: A robust dictionary should include data types, source systems, refresh frequencies, allowed values (for columns), and calculation principles for measures.
Use INFO.VIEW Functions: They create calculated tables that automatically retrieve model metadata.
Use AI (with Human Review): Large Language Models (LLMs) like ChatGPT, Claude, Gemini can be used to draft descriptions based on DAX code. But do not forget a human review. Validate AI-generated output to prevent hallucinations.
Extract with External Tools: For large models, tools like DAX Studio (with DMV queries) or Tabular Editor are recommended for bulk metadata extraction and management.
Embed Within the Report: Build a dedicated report page for the data dictionary.
Make it Interactive: Enhance the dictionary page with search bars (keyword slicers) and type filters (filtering for Measures vs. Tables).
Assign Clear Ownership: Every dictionary or major data element should have an assigned owner or data steward responsible for its accuracy.
Prepare for Handover:
When you complete a project, your data dictionary serves as the final deliverable.
It demonstrates your care and precision in building the model and gives the next person the roadmap they need to maintain the report. A well-documented report is a sign of a professional data analyst. It shows that you value accuracy and transparency.
By following these steps, you create Power BI solutions that are reliable and easy to use.
Make the data dictionary a non-negotiable part of your development process.
The report is not finished until the documentation is complete. By following these guidelines, you will create a comprehensive Power BI data dictionary, and will provide other people the information they need.
Your reports will be clear, accurate, and professional.
💡Follow me for more Power BI tips every week.
How do you currently document your Power BI measures?
Let me know in the comments👇
Excellent advice on the mandatory human review for AI-generated descriptions. It’s easy to let tools automate the work, but as you noted, a domain expert is required to ensure the context matches the organizational reality. Thanks for highlighting that.